Cropwise Balance
Farm costs, purchases, stock and results in one product, designed and shipped as an MVP in a few months.
Context
One farm, many spreadsheets
For a farm manager, purchases, invoices, stock and results are parts of the same story.
Inside Cropwise Balance, Syngenta’s Farm Management System had to bring purchasing, invoices, stock movement, material consumption, accounting reports and financial results into one place, with a few months to reach an MVP.
My role
Close to the build
- Worked directly with the product manager and the engineering team
- Turned business rules and functional requirements into flows
- Designed interfaces and prototypes from concept through implementation
- Kept the modules consistent through shared navigation, table and feedback patterns
Decisions
Make status and money readable at a glance
Decision 1
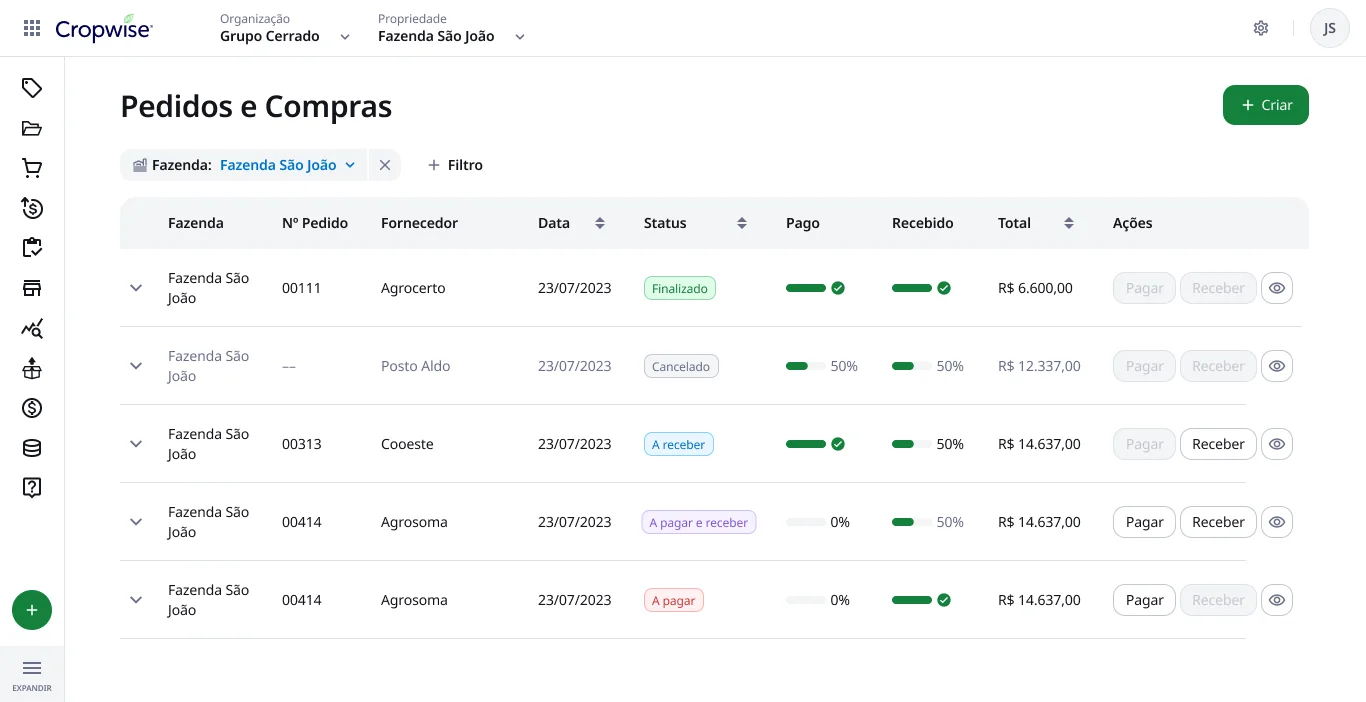
Split “paid” and “received” out of the order status
- Problem
- An order can be finalized, canceled, partly paid or partly received. A single status hid where the money and the goods actually were.
- Change
- One status label, plus two separate progress indicators for payment and receipt. Pay and Receive become active only when there is something left to do.
- Why
- Managers scan dozens of orders. The next action should be visible without opening each one.
Decision 2
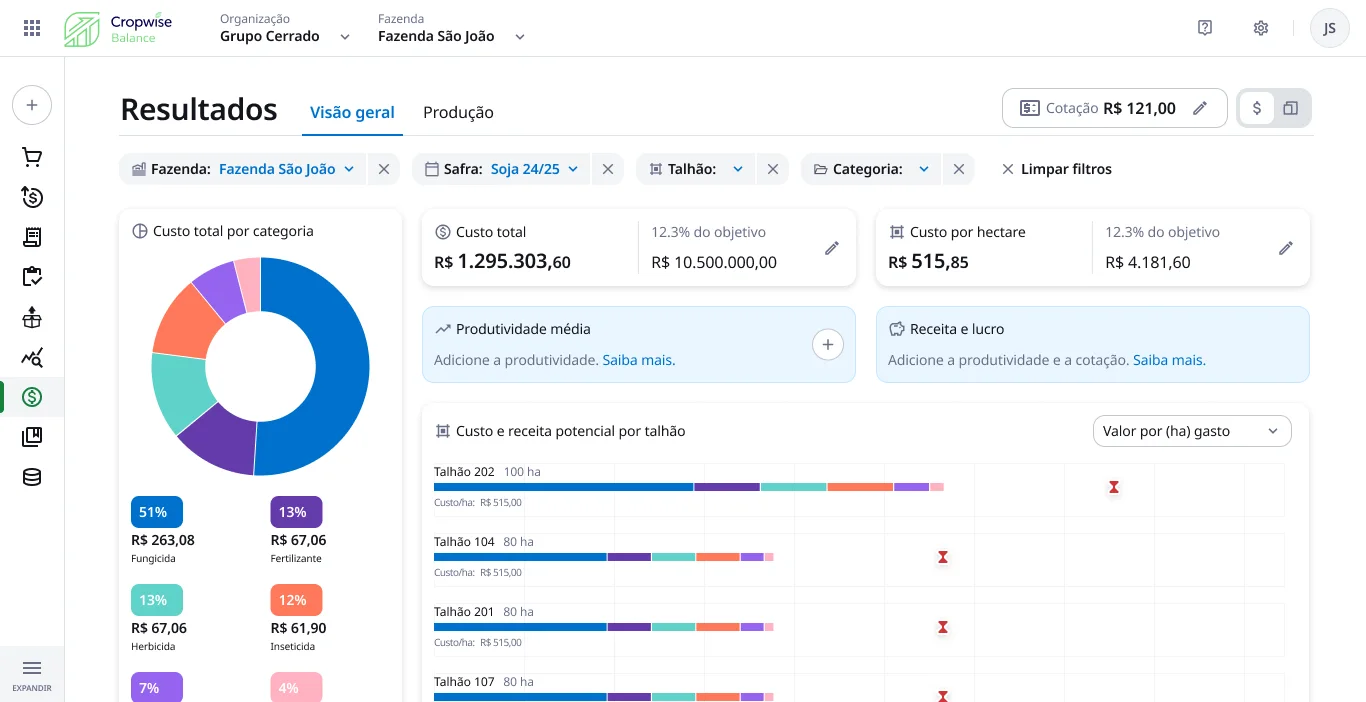
Results: the big numbers first, then the why
- Problem
- Cost data only matters next to a target and a field. Revenue depends on data many farms hadn’t entered yet.
- Change
- Total cost and cost per hectare against their targets at the top, composition by category on the left, cost and potential revenue per field below. Filters for farm, season, field and category sit together as chips.
- Why
- Missing productivity data becomes a prompt to add it, not an empty chart.
Outcome
Shipped to real farms
The MVP was delivered and five customers were onboarded for real-world testing. Under that deadline, the lesson was focus: clear rules in the system and daily contact with engineering mattered as much as the polish of any single screen.